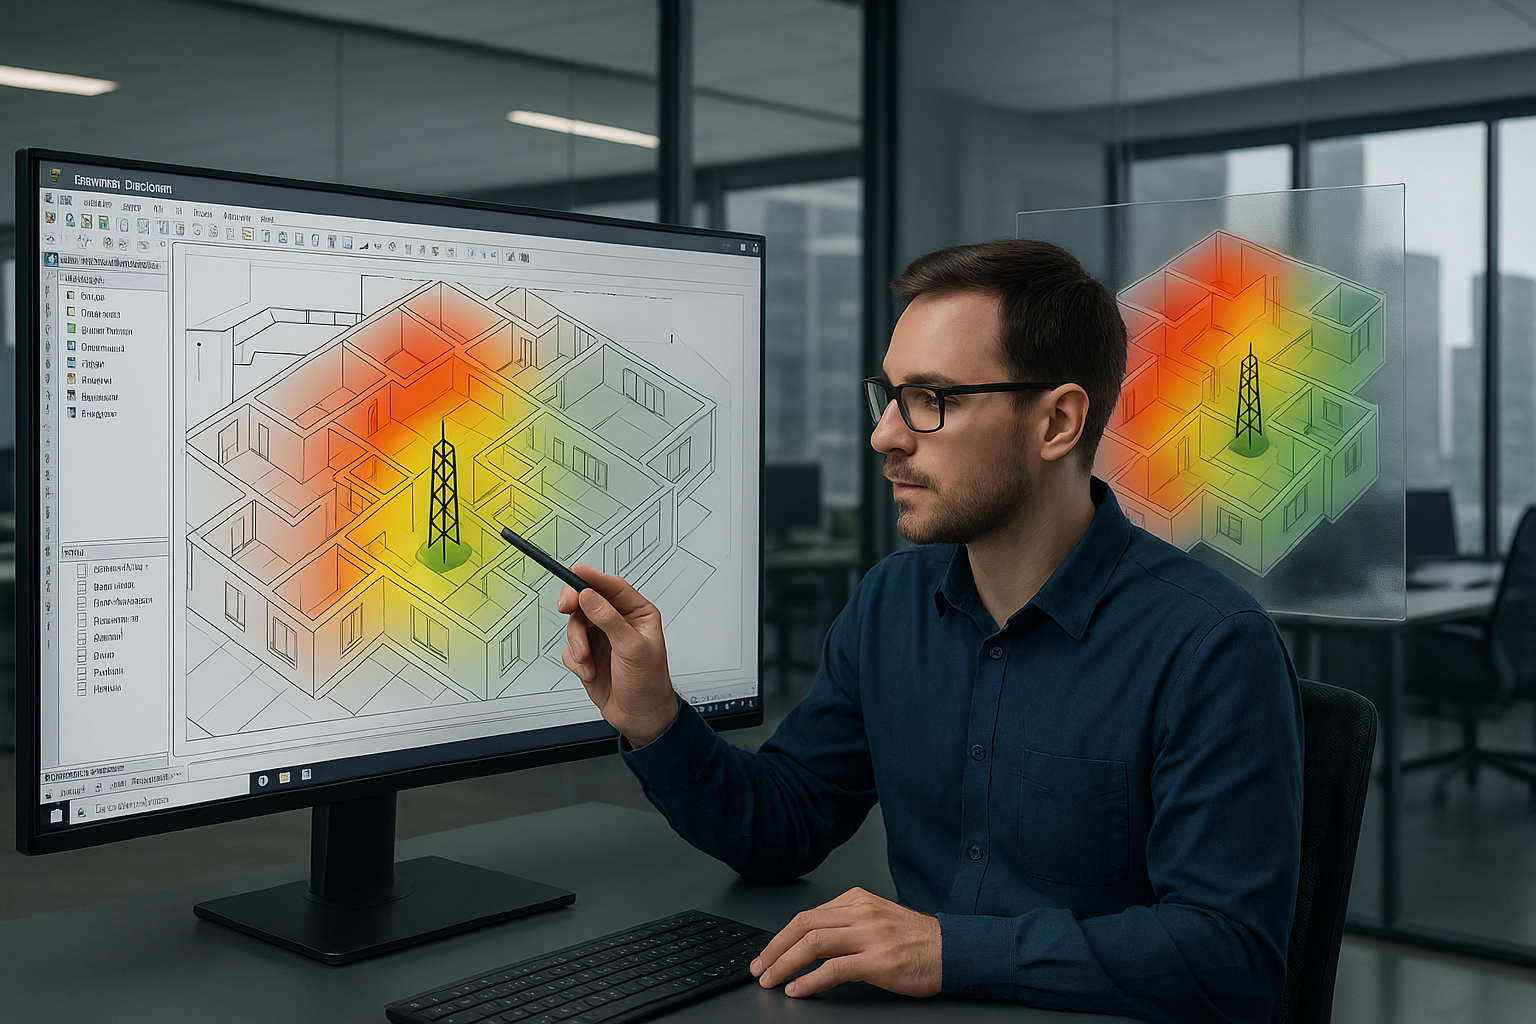
In today’s hyper-connected world, reliable indoor cellular coverage is no longer a luxury—it’s an expectation. Yet building materials, complex floorplans, and RF interference often conspire to leave users scrambling for signal. That’s where IBwave’s industry-leading planning and design software comes in. In this post, we’ll walk through a recent real-world deployment that leveraged IBwave to transform a challenging indoor environment into a high-performance cellular oasis.
The Challenge: A Signal Desert
-
Environment: Five‐story commercial office (≈50,000 sq ft)
-
Obstacles: Reinforced concrete, metal-framed partitions, dense furniture layouts
-
Existing Performance: 0–1 bars LTE indoors; frequent dropped calls and data black spots
-
Client Need: Full 4G throughput (≥50 Mbps) on every floor, with seamless handoff
Traditional drive‐tests and on-the-fly installations kept ending in disappointment—antennas placed in corridors didn’t reach private offices, and blind spots around meeting rooms persisted. The client needed a data-driven, predictive approach to nail coverage on the first pass.

Why IBwave?
IBwave Designer offers:
-
3D Floor‐plan Modeling
Import CAD/blueprint files and accurately model walls, doors, furniture, and RF‐absorbing materials. -
Predictive RF Simulation
Run propagation studies to see coverage heatmaps before any hardware is installed. -
Vendor‐agnostic Equipment Library
Choose DAS heads, remote units, small cells, and antennas from all major vendors. -
Automated Reports
Generate bill-of-materials, path‐loss plots, and installation drawings in minutes—perfect for approvals and budgeting.
Our IBwave Workflow
-
Blueprint Import & Layering
We began by importing the architect’s CAD drawings and defining material properties (e.g. concrete, glass, drywall). -
Initial RF Simulation
Running a “dry” simulation revealed deep nulls in corner offices and meeting pods—insights you simply can’t get with site-surveys alone. -
Antenna Placement & Optimization
We tested various DAS head locations and antenna tilt angles, iterating until the 3D heatmaps showed ≥–90 dBm everywhere. -
Link Budget & Capacity Planning
Factored in peak user density and traffic profiles to size the backhaul and select amplifier gains. -
On-Site Validation
After installing the agreed‐upon equipment, a quick drive‐test confirmed predictions were within 3 dB of simulated results.
Real-World Results
| Metric | Before | After |
|---|---|---|
| Average Indoor RSRP | –100 dBm | –85 dBm |
| Peak 4G Download Speed (office pods) | 8 Mbps | 65 Mbps |
| Call Success Rate | 78 % | 99.2 % |
| Number of DAS Heads | N/A | 4 (distributed) |
| Planning & Reporting Time | N/A | < 4 hours |
Key Takeaway: Predictive planning with IBwave shortened field-work by 60 %, slashed hardware churn, and turned a “dead zone” into a network showcase.
Best Practices & Tips
-
Accurate Material Definitions: Always verify wall/FIT-out materials on site; default libraries can drift from reality.
-
User-Density Profiles: Model peak usage (e.g. conference rooms at lunchtime) to avoid capacity pinch-points.
-
Iterative Simulations: Don’t settle after one pass—little adjustments to antenna height or tilt often solve stubborn nulls.
-
Integration with Site-Survey Tools: After IBwave planning, use hands-free testers (e.g., TEMS Pocket) to validate with minimal effort.
-
Collaborate Early with Facilities: Getting CAD layers and approving equipment pathways before ordering saves weeks.
Conclusion
Optimizing indoor cellular coverage doesn’t have to be a game of trial‐and‐error. By leaning on IBwave’s predictive RF simulation and robust reporting tools, you can deliver carrier-grade performance on day one—every time. Whether you’re rolling out a new DAS project or overhauling an aging in-building network, IBwave’s data-centric approach will save you time, budget, and headaches.
Ready to see IBwave in action on your next project?
Contact our DAS specialists today to schedule a demo and start planning your most reliable indoor network yet.

Leave a Reply